Open interest in crude oil reaches record levels
IN THIS MONTH'S Chart of the Month article, we take a look at the two most actively traded crude oil futures contracts, the WTI light sweet crude oil futures traded on the New York Mercantile Exchange and the Brent crude oil futures traded on ICE Futures Europe. These two contracts are among the most important benchmarks for oil prices in the world and play a central role in risk management for oil producers and consumers.
Figure A shows open interest for both contracts measured on a monthly basis over the last 10 years. The chart shows that both contracts are in the midst of a long-term upward trend in the number of open positions, which is a strong indication of greater commercial interest in these contracts. Open interest for both contracts reached a record high in the month of October and the levels of open interest are now more than 60% above where they were three years ago.
FIGURE A
Open Interest in Oil Futures
This chart shows the month-end open interest in the two leading crude oil futures contracts.
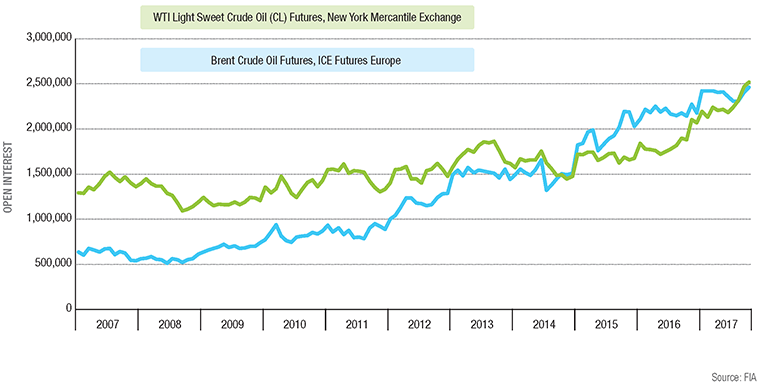
The chart also shows an interesting difference in the growth trend. Historically, the Nymex contract had a higher open interest than the ICE Brent contract but since mid-2011 Brent has been growing more rapidly than WTI and in October 2014 it surpassed WTI to become the world's top oil futures contract in terms of open interest.
The pattern reversed two years later. Since the beginning of 2016, WTI started showing significant growth in open interest. By August 2017, WTI open interest had caught back up to Brent and by October it was once again number one.
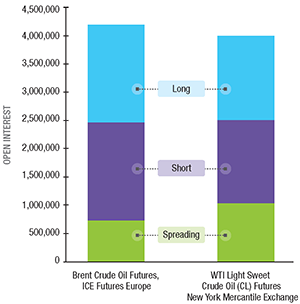
FIGURE B
Open Interest by Type of Position
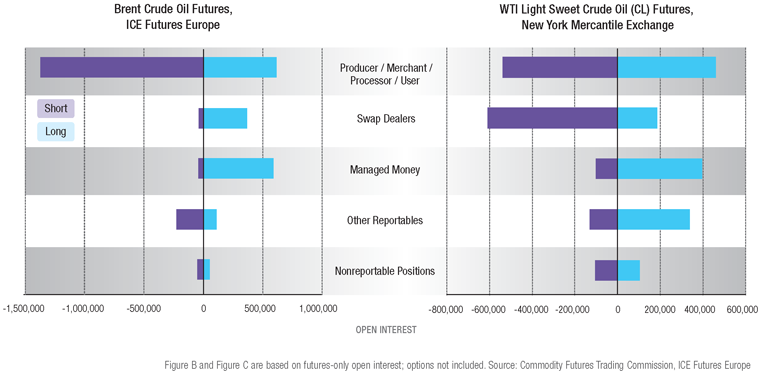
To get more information about these open interest trends, we took an in-depth look at the breakdown of open interest by type of position and type of market participant. Using publicly available data from the CFTC commitments of traders reports for the Nymex WTI contract and the comparable report published by ICE for its Brent contract, we created two graphs.
Figure B shows the number of futures contracts held on Oct. 31, 2017 in long, short and spreading positions. A long position means that the position holder has an obligation to buy; a short position means the opposite, and a spreading position means that the position holder is holding equal long and short positions.
The two graphs in Figure C show some important differences in the balance of open interest. For WTI, the swap dealers account for the largest share of the short positions. Typically swap dealers hold these positions in order to offset the risks they take in the OTC market. The fact that swap dealers are mainly on the short side of the futures market suggests that their clients in the OTC market are also on the short side, i.e., using the swaps to express a view that prices will go down. Producers and merchants, on the other hand, are more or less evenly balanced between long and short positions in WTI.
For Brent, producers and merchants account for almost all of the short interest, and swap dealers are almost entirely on the long side of the market. However, the size of the swap dealer open interest for Brent is much smaller than it is for WTI. For both contracts, the managed money category is primarily on the long side of the market, which indicates that funds speculating on the direction of oil prices are generally expecting prices to rise.
FIGURE C
Open Interest by Type of Market Participant