How network theory can illuminate the topography of clearing risk
Global regulators are becoming increasingly aware of the importance of market infrastructures in the systemic risk topography. In particular, regulators are recognizing the need to understand the interconnections between clearinghouses and their members, which have the potential to transmit the shocks from a default or operational incident in unexpected ways. In this article, two experts on network theory show how this type of data analytics can provide regulators and market participants with a better understanding of the connections within the global clearing system.
Advances in data analytics provide market regulators with better tools to understand connections within financial systems. One example is “interconnectivity” among participants in the global derivatives markets, and in particular, the clearinghouses that now process the majority of derivatives transactions worldwide.
These clearinghouses, also known as central counterparties, have become an important part of the financial landscape. They help protect the stability of the financial system by reducing counterparty, operational, market, legal, settlement, and default risk for market participants. However, CCPs also concentrate risks, and their financial and operational soundness is critical for the smooth functioning of the financial system. In addition, CCPs rely on their members to provide the majority of their financial resources. Many of these clearing members belong to multiple clearinghouses, so the landscape of clearinghouses and their members is highly interconnected.
Over the last several years, the potential for these connections to become a source of systemic risk has become an area of concern at the highest level of the regulatory community. In July 2017, the four groups that oversee the global financial system—the Basel Committee on Banking Supervision (BCBS), the Committee on Payments and Market Infrastructures (CPMI), the Financial Stability Board (FSB) and the International Organization of Securities Commissions (IOSCO)—published an initial analysis of central clearing dependencies based on data from 26 central counterparties in 15 jurisdictions. The four bodies followed up a year later with a second report in August 2018. In both cases, the regulators provided initial mappings of the relationships among CCPs and their members in order to understand how the failure of one institution might affect the rest of the network.
By focusing on the connections between institutions, individuals, transactions or exposures, network theory allows the discovery of complex relationships and hidden risk concentrations.
Network theory can provide greater transparency and insights into these connections. Network theory is a proven branch of quantitative analytics regularly used in other industries. For example, Google uses network theory to rank websites in its search engine results, and Amazon uses it in its product recommendation engine. Network theory increasingly is being used in broad areas of finance and economics including systemic risk analysis, payment system oversight, banking credit risk, liquidity risk management, and fraud detection. By focusing on the connections between institutions, individuals, transactions or exposures, network theory allows the discovery of complex relationships and hidden risk concentrations. In the remainder of this article, we use network theory to investigate the interconnections between a sample set of CCPs and their members.
There are currently approximately 100 CCPs in the world. Some specialize in a small number of a sample set of products (for example the Minneapolis Grain Exchange specializes in futures and options based on hard red spring wheat), while others support a wide array of transaction types (for example, CME clears futures and options as well as interest rate swaps). The typical CCP has a few hundred clearing members; the largest CCPs have over 1,000 members, while some smaller CCPs may have only a handful. The Johannesburg Stock Exchange in South Africa, for example, has only eight clearing members.
Thanks to internationally agreed-upon risk management standards and regular stress testing, the insolvency of a CCP is generally considered to be highly unlikely. That being said, there have been three major failures in the past. The most recent was the Hong Kong Futures Exchange Clearing House, which failed in 1987 in the wake of the global equity market crash.
A more likely scenario than CCP insolvency is the default of one of the clearing members. A clearing member default may affect the other clearing members associated with that CCP, and if the defaulting clearing member belongs to many CCPs (as is often the case, especially for large institutions), the clearing members of all of its associated CCPs may be affected. Moreover, although CCPs have strong risk controls in place to prevent their own insolvency, other risks remain. In the event of an operational disruption or liquidity shortage within a CCP, its members would be affected, thereby potentially affecting other CCPs that its members are associated with, and then affecting the members of those CCPs, and so on. Given this, contagion in the network defined by CCPs and clearing members could potentially affect a large portion of the financial system, even in the absence of a CCP’s insolvency.
Mapping the network defined by CCPs and clearing members
We believe that network theory is well-suited to assess and visualize of this risk. To demonstrate its potential, FNA has compiled a database with the names of CCPs and their members and applied network theory to create a map of the interconnections. Although we used only a small sample of the data now available to regulators, we believe this type of data analytics can help regulators, CCPs and their members enhance their risk management as it can be publicly shared, unlike regulatory data and the analysis done by the BIS and other supranational institutions which must be anonymized. It should be noted, however, that we do not have a complete set of data on clearing relationships due to gaps in public disclosures; these network visualisations should be understood as examples of the kind of analysis that can be done, rather than definitive findings.
CCPs disclose their clearing members, thus making it in principle straightforward to compile a database of CCPs and their members. However, the lack of consistent naming conventions for banks and their subsidiaries complicates data consolidation. The LEI (Legal Entity Identifier) was established in 2014 as standard to provide clear identification of a financial institution. The LEI may be used in place of a bank’s name to avoid ambiguity, although determining an institution’s LEI is often a non-trivial task as these are not reported by the CCPs.
Because an insolvency could affect the insolvent institution’s parent company, and possibly the parent company’s parent company, as well as other subsidiaries of the parent companies, it often makes sense to work with the ultimate parents of clearing members rather than the members themselves. Getting that information is a difficult task, however. Most global banks run their clearing businesses on a global basis, but their clearing memberships are often in the name of a local subsidiary. Bank of America, for example, is a clearing member of the Japan Securities Clearing Corporation and the Tokyo Financial Exchange through Merrill Lynch Japan Securities Co. Ltd.
FNA created a dataset of 29 CCPs that clear derivatives or securities. These CCPs have a total of 811 clearing members, which are subsidiaries of 563 parent companies. In most cases, we were able to identify the clearing members by their LEI, but we removed 120 clearing members—around 9% of the original total—whose LEIs could not be found. We also used the data repository provided by the Global LEI Foundation, which was established by the FSB to support the implementation of the LEI, to look up Relationship Records, also known as Level 2 data, which include an institution’s direct and ultimate parent companies. Level 2 data is not currently available for all institutions with LEIs, and ultimate parent companies were obtained via Relationship Records for only about 25% of the clearing members considered. The remaining parent companies were found via manual lookup from a variety of sources including Bloomberg, Wikipedia, and D&B Hoovers.
We then created a series of diagrams showing the network from various points of view. In digital form, the diagrams are interactive; they allow users to zoom into one part of the network, or filter the data in various ways, or drill down to show only a single node and those nodes directly linked to it.
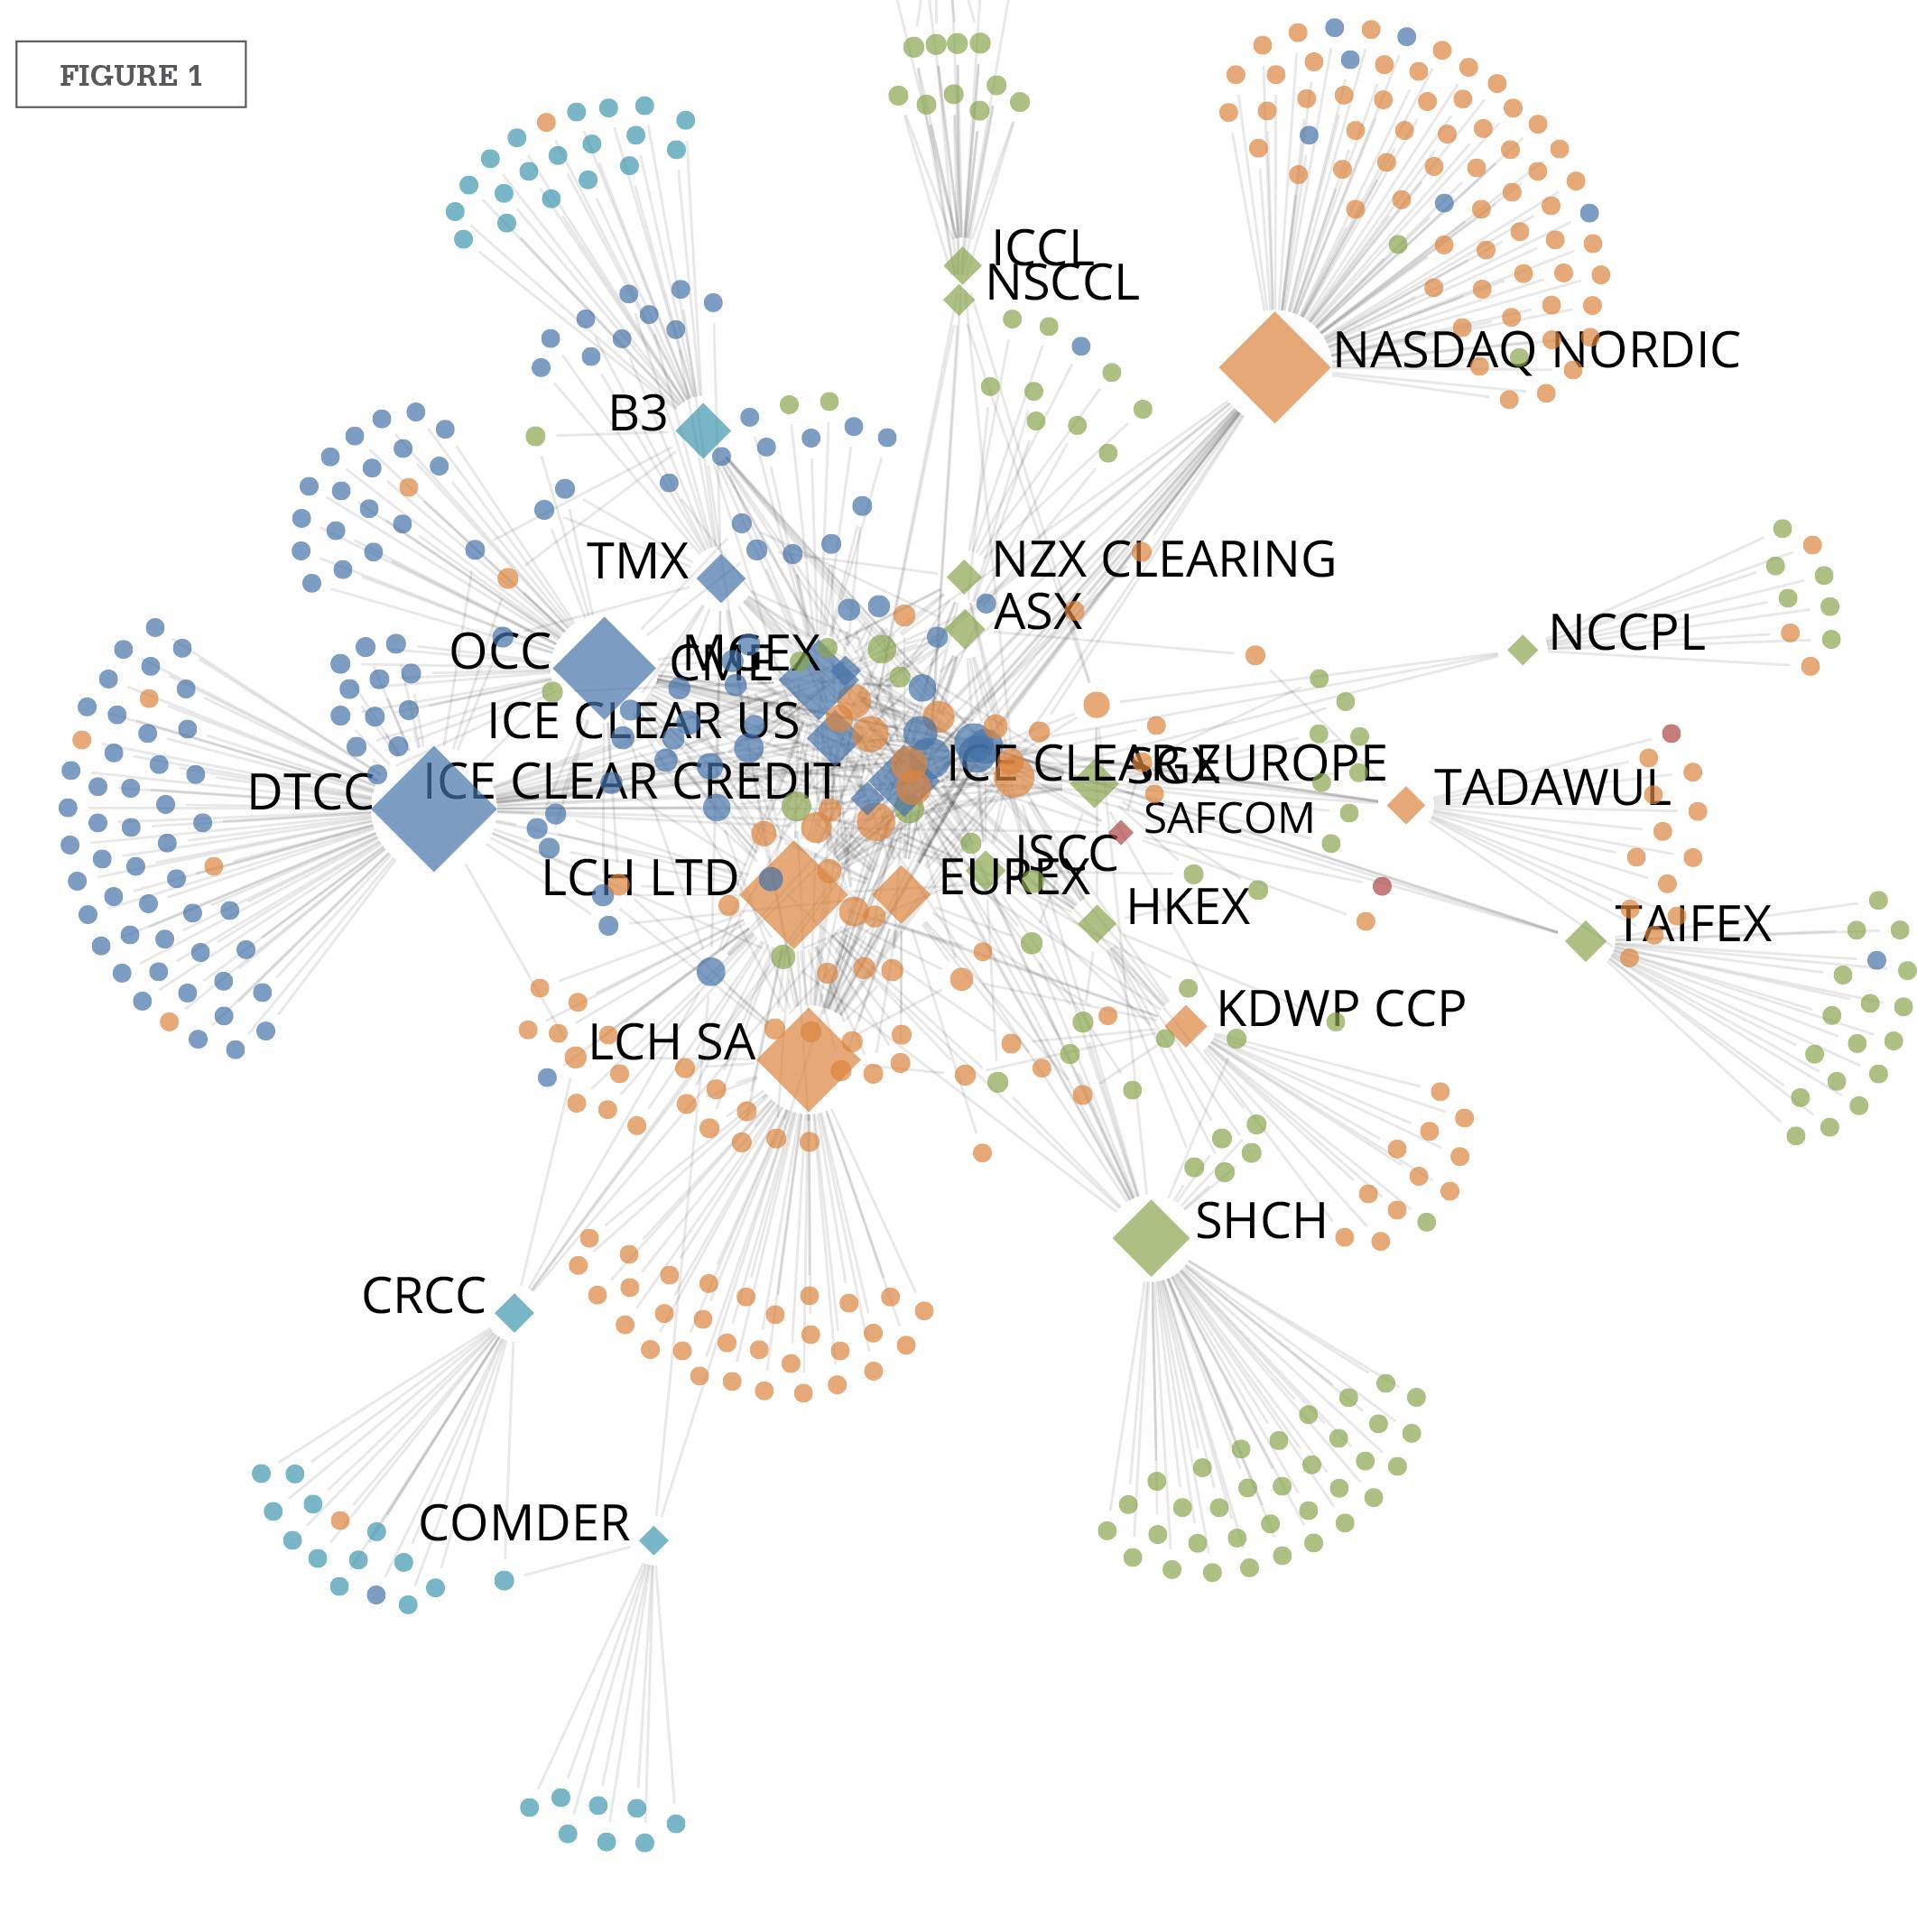
Figure 1 provides an overall view of the network. Diamond shapes represent CCPs, circles represent clearing members, and links represent membership between clearing members and CCPs. Network visualizations enable us to map additional information into the pictures. The size of the nodes scales with the number of links; the larger the number of clearing members, the larger the size of the diamond. Additionally, the distance of the nodes scales inversely with the degree of interconnectedness; the farther a CCP is from the center, the fewer interconnections it has with the rest of the CCPs. The color of each node reflects the region on which the entity is based: Blue (North America), Light Blue (South America), Orange (Europe and Middle East), Red (Africa) and Green (Asia and Pacific). Note that we have suppressed the names of the clearing members to simplify the visualisation.
The diagram shows that most CCPs are highly connected to the rest of the network, but there are few, such as Chile’s ComDer and Pakistan’s NCCPL, that have many clearing members that belong to no other CCPs.
The footprints of individual CCPs
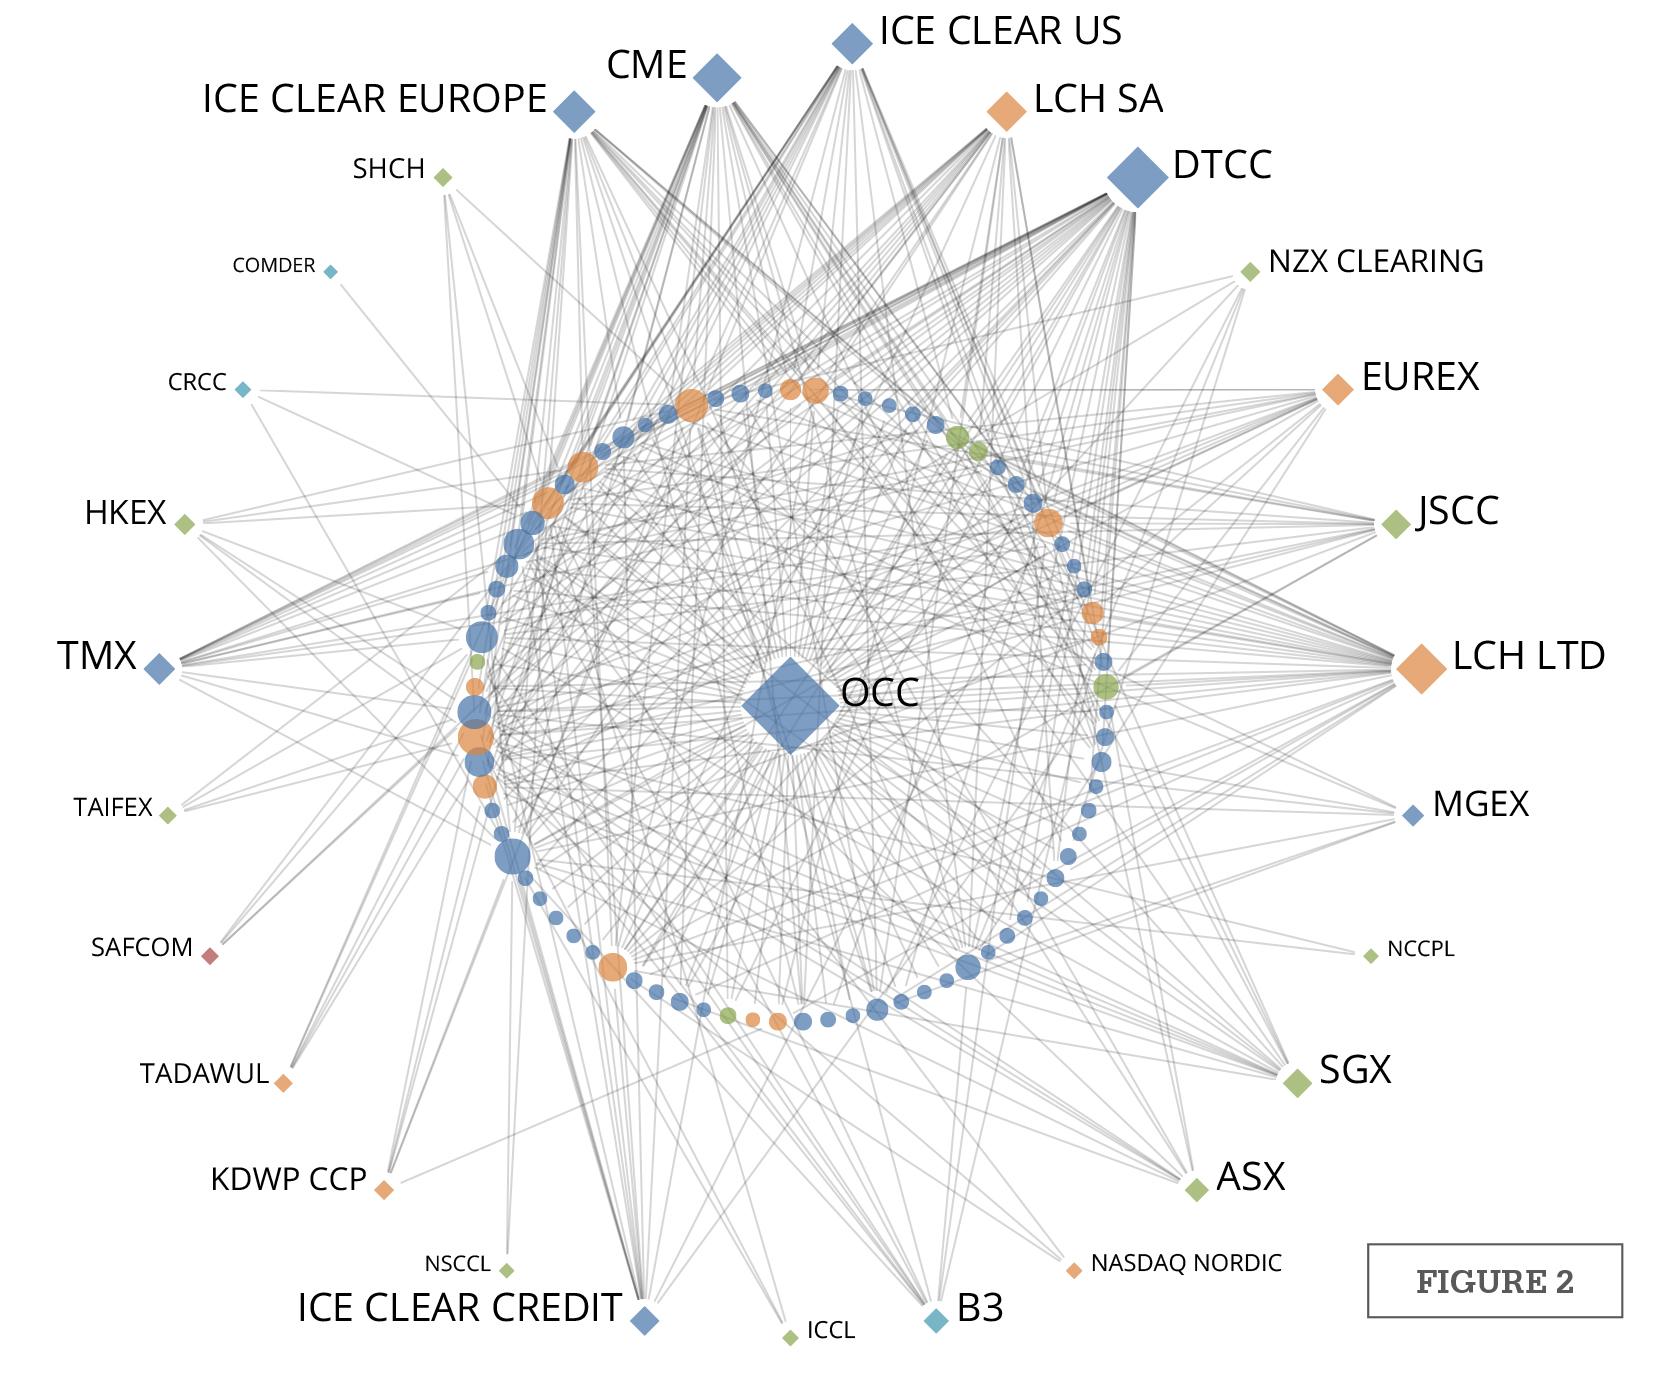
To explore the role in the network occupied by a single CCP, we can consider its clearing members along with all of the other CCPs of which its clearing members are members. Figure 2 shows such information for Options Clearing Corporation, a CCP based in Chicago. OCC was selected for illustration as it recently reinforced its clearing fund methodology by switching to Cover 2, in which the clearing fund is sized to cover the simultaneous default of its two largest members.
OCC’s 79 clearing members are mainly in the U.S. (blue node = North America), and it also has several members based in the European Union (orange nodes), with a few in Asia-Pacific (green nodes). OCC’s clearing members are linked to 27 of the remaining 28 CCPs in the data set, and we see in particular that OCC COMDER has many members in common with CME, DTCC, and LCH Ltd. OCC also has common members with some of the smaller CCPs, including NCCPL and NSCCL (India). In network theory parlance this type of visualization is appropriately called an “ego” network view.
The footprints of clearing members
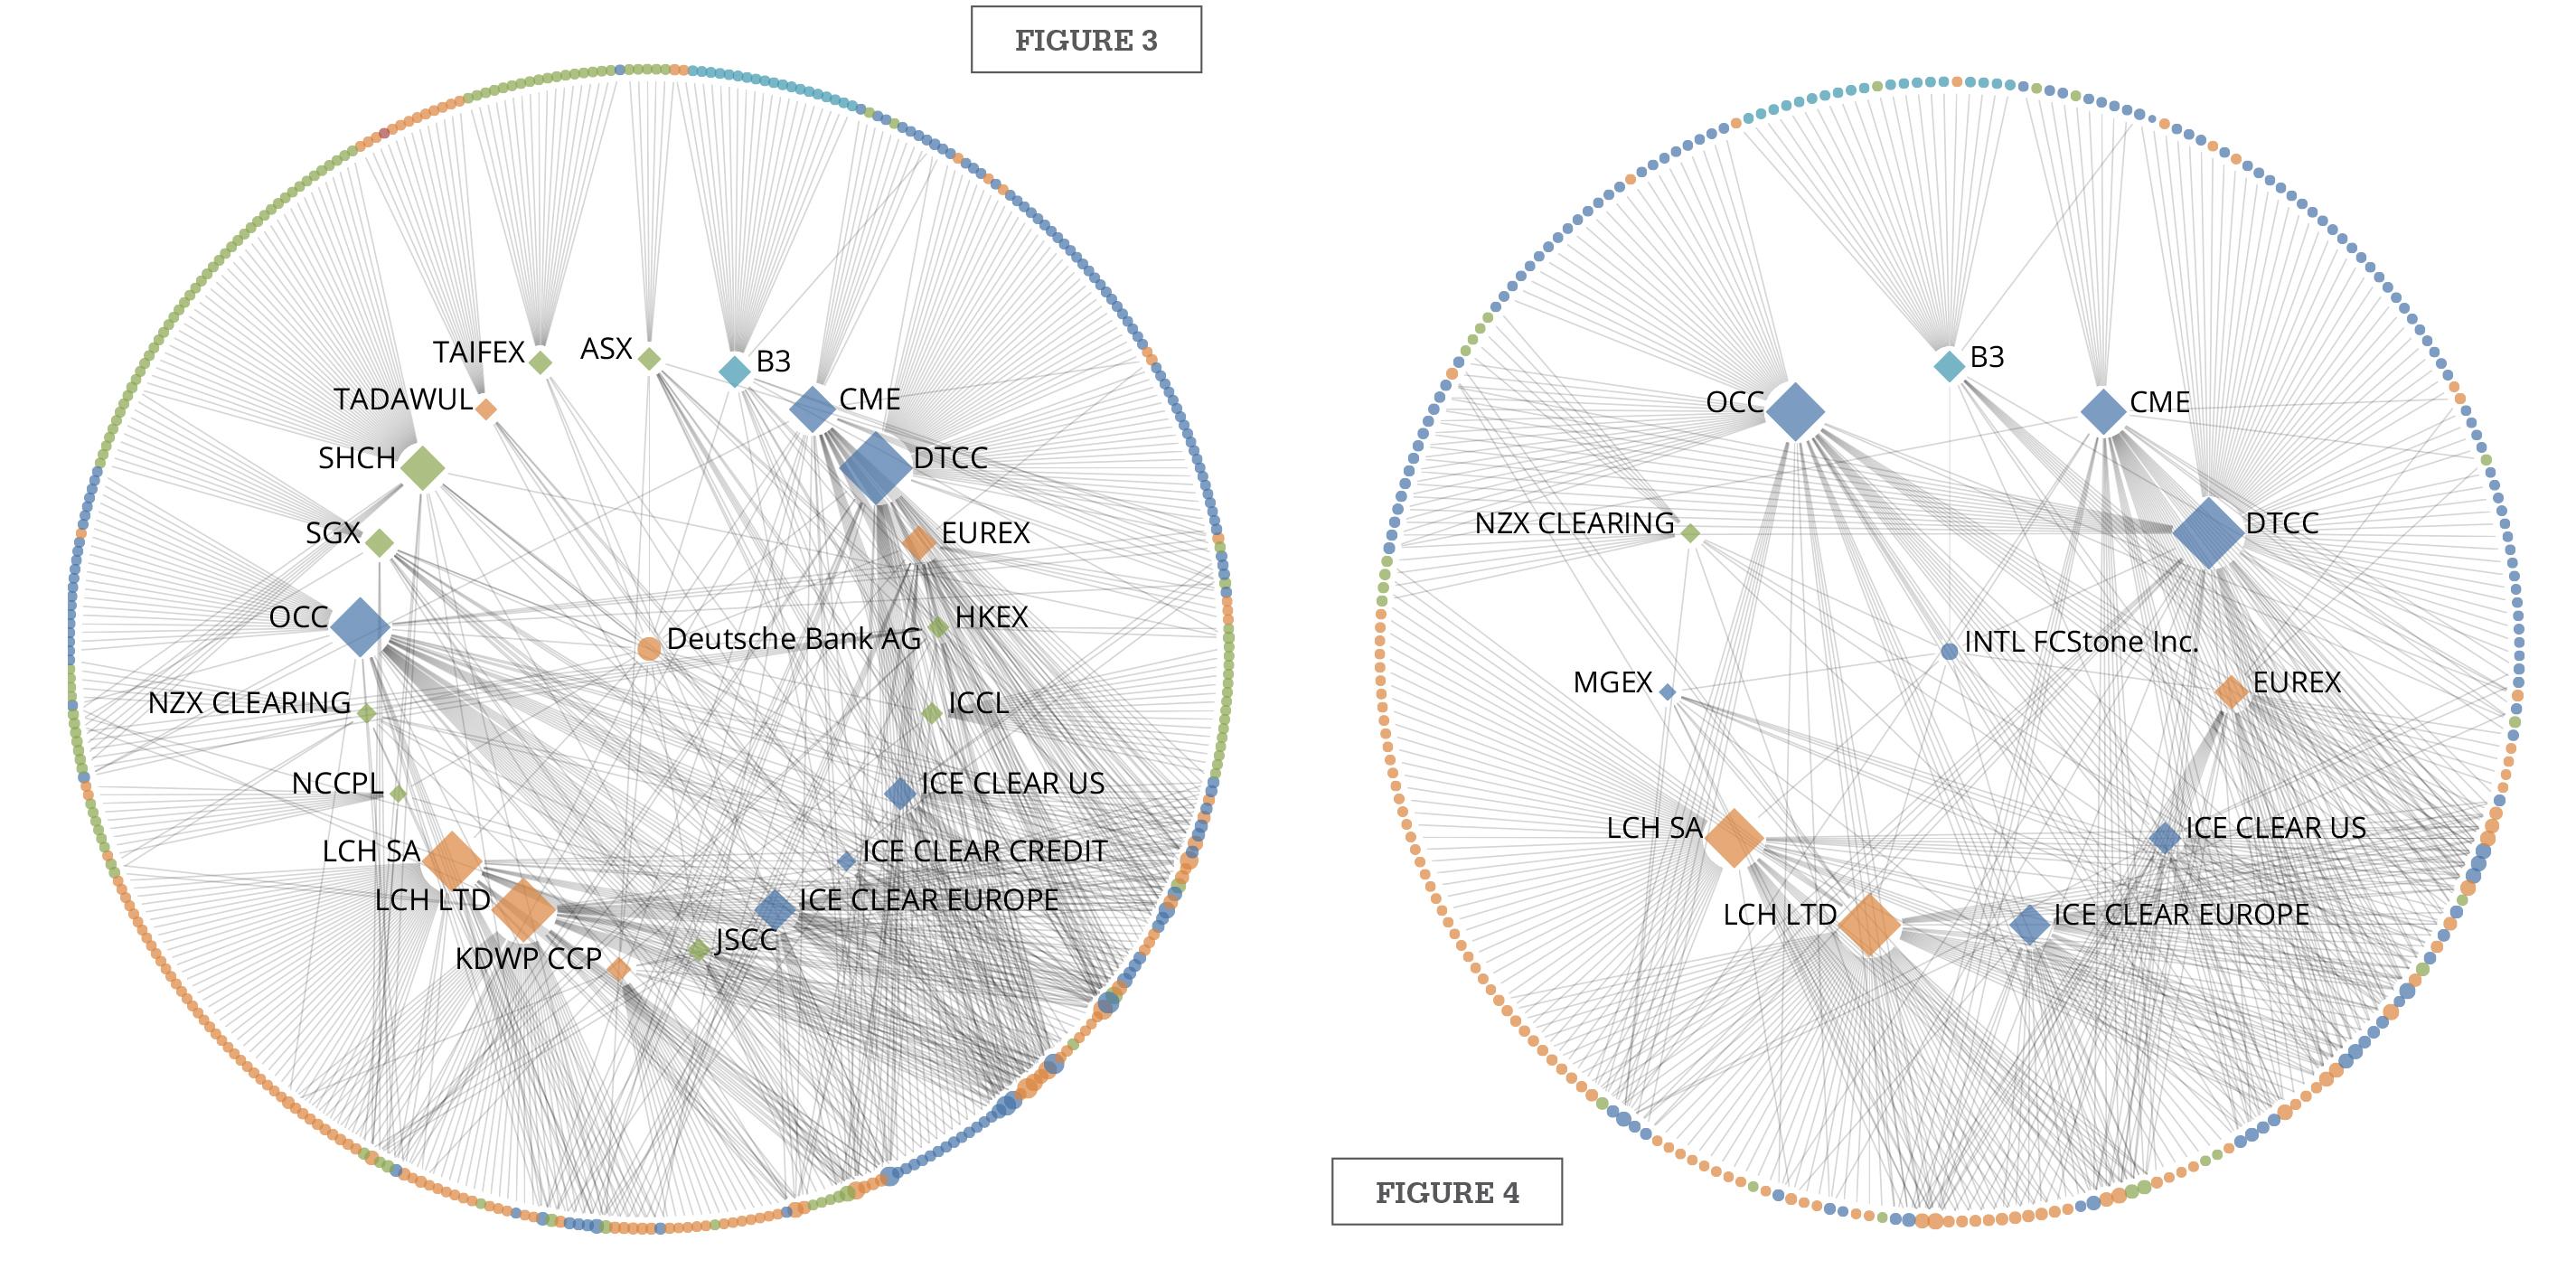
Conversely, we can explore the role of a single clearing member by focusing on its associated CCPs and the clearing members of those CCPs. Figure 3 illustrates this for Deutsche Bank, which is one of the most connected global clearing members as measured both by the number of its CCP memberships, and by the number of other clearing members that belong to its associated CCPs. Deutsche Bank’s associated CCPs and their clearing members span the globe, with institutions in North America, Europe, Asia, the Middle East, Australia and Oceania, and Latin America.
Of course, not all clearing members are banks. Figure 4 shows an example of a nonbank firm, INTL FCStone, along with its associated CCPs and all of their clearing members. Based on the information that we were able to find, we determined that INTL FCStone is a member of 11 CCPs based in Europe, North America, South America and Pacific and it is connected via those CCPs to 265 other global financial institutions.
The way ahead
So what does this analysis tell us? First and foremost, it gives us a perspective on one dimension of systemic risk, i.e., the number of connections that any one entity in the global clearing system has with the rest of the network. This can help overcome the limitations of the current framework for CCP risk management, which is mainly focused on the risks affecting individual CCPs.
Using this approach, supervisors can identify the institutions that have the greatest potential impact on the clearing system as a whole, rather than focusing on a single CCP. This can help improve the design of supervisory stress testing exercises involving multiple CCPs. It can also serve as a practical basis for dialogue between CCPs, their members and their regulators.
Admittedly, the number of connections is only one dimension of interconnectedness. Systemic importance needs to be looked at in broader ways, for instance by taking into account the types of contracts they clear, the value of the contracts they clear, the amount of margin they receive, and the amount of money they hold in their default funds.
In recent years the international standard-setting bodies have provided guidelines on the quantitative data that CCPs are expected to disclose. Many CCPs have already made publicly available such quantitative disclosure information, including default resources, measures of credit and liquidity risk, margin amounts, profits, assets, and liabilities.
We look forward to working with the derivatives industry to continue to augment the quantitative information to the network mapping analysis and to start building simulation models to get a better understanding of possible pathways of contagion. This would benefit all participants in the financial markets by allowing more precise measures of risk concentrations as well as the ability to simulate stress scenarios of interconnected market infrastructures.
Kimmo Soramäki is the founder and chief executive officer of Financial Network Analytics. Samantha Cook is the chief scientist at Financial Network Analytics.